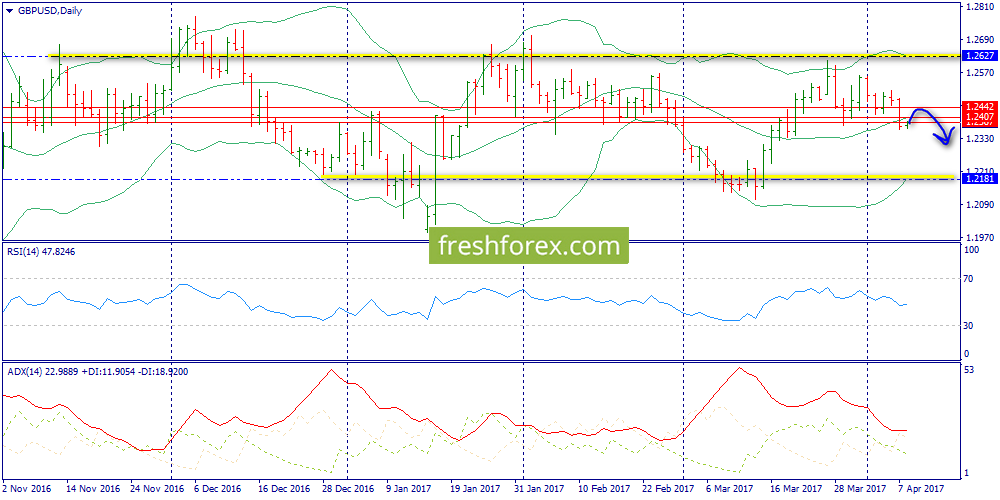


10 tháng tư 2017, GBP/USD
Daily chart: support level at 1.02407 (middle Bollinger band) is broken, and the price may drop to lower Bollinger band (1.2181) without interruption. However, ADX doesn't show active trend, so we may see flat.

Н4: there is technical upside correction towards middle Bollinger band (1.2442) following several pinbars beyond Bollinger envelope borders. Support level is at 1.2363 (lower Bollinger band).

Н1: here resistance level is at 1.2421 (upper Bollinger band), but ADX already supports bulls.

Expectations:
Core scenario - touching 1.2421 followed by drop to 1.2363
Alternative scenario - shot to 1.2442 and then decline.
Trading signals: consider entering short after correction to region of 1.2421-1.2443.
