

17 January 2019, GBP/USD

Wave Analysis
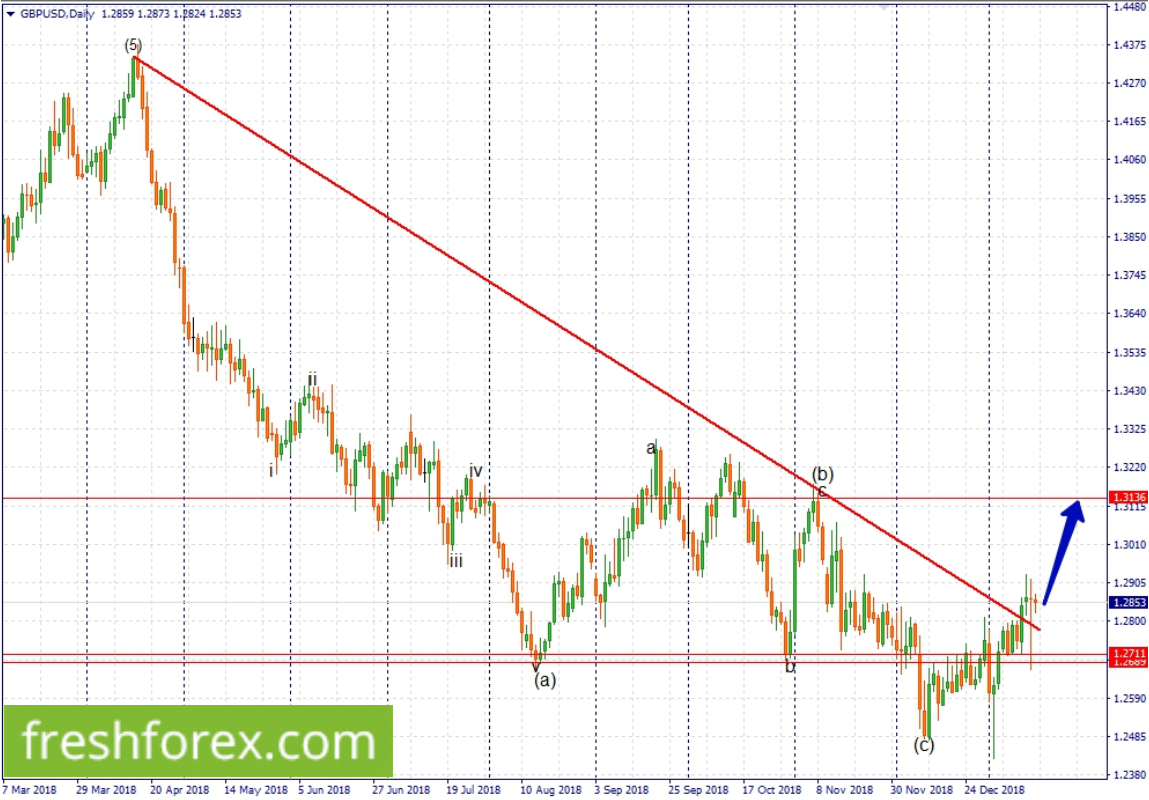
According to the weekly chart attached, we're still in an active trend to the lowerside, the current move we're seeing to the upperside is mere correction and should not go beyond the weekly resistance level 1.30616, if you're an intraday trader, then you may look for long position towards 1.30616. As it is on the weekly chart attached, only a break below 1.27053, will attract a possible sell position towards 1.20905. According to the daily chart below, we're still waiting for a possible second pullback to the lowerside to pick a long position towards 1.3136.

Trade Recommendations:
if you're not long already, wait for a possible correction to pick a long term buy position towards 1.3136.
