Sell from 113.66 | 14 February 2017
14 February 2017, USD/JPY
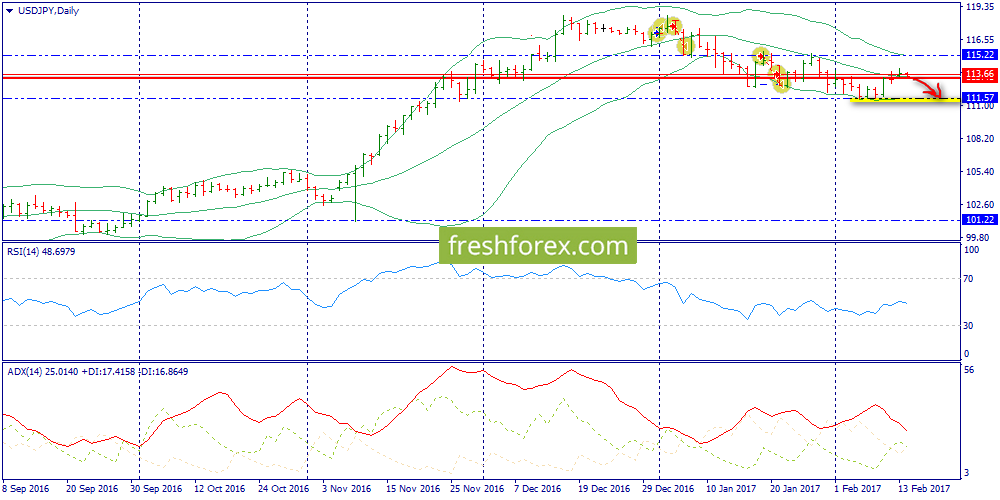
Daily chart: although there have been some upward attacks, we still expect new drop towards lower Bollinger band (111.57) supported by general declining structure of the chart.

Н4: at the moment price is inside upper Bollinger envelope (113.41-114.45). In support level region at 112.03 we can see upward Over&Under pattern. General decline is likely to have complex trajectory (including mid-term rise from 112.03 to 114.45)

Н1: ADX/RSI move in opposite directions showing strong resistance in 113.66 region (middle Bollinger band). That's why we are expecting drop from 113.66 towards 112.03

Expectations: we expect the price to touch 113.66 and then drop towards 112.03
Solutions:
1. Consider selling from 113.66 to 112.03
2. Consider limited buying from 112.03
