90 pips for today trading | 15 Febrero 2017
15 Febrero 2017, GBP/USD
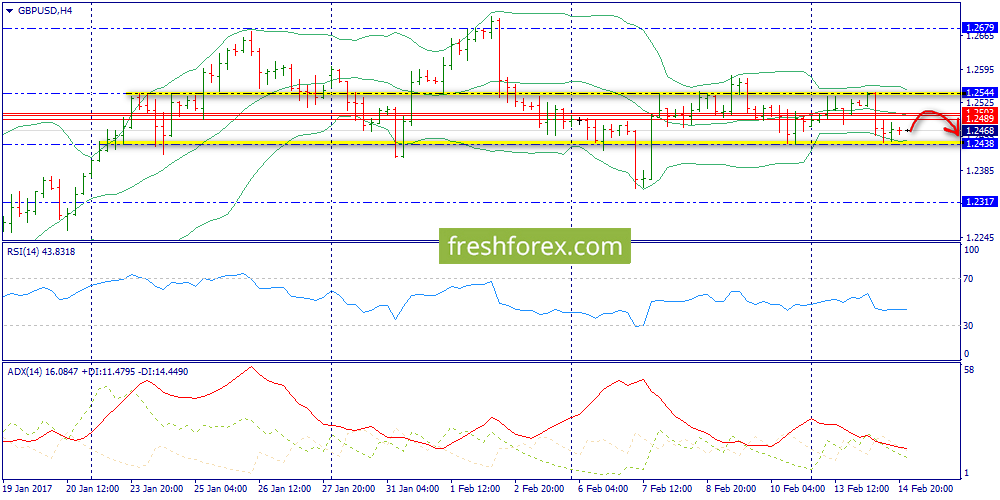
Daily chart: there is almost no changes - flat around middle Bollinger band (1.2489) inside broad range of 1.2317-1.2679

Н4: more localized flat corridor is inside Bollinger envelopes (1.2438-1.2544). As we might see, ADX is very weak and passive, that's why the price is likely to stay within the specified borders during the day.

Н1: it is the only trend frame (in bears favor). Resistance level at 1.2489 (middle Bollinger band) allows us to sell in case of this level touching. Lower Bollinger band sank lower than support level at 1.2438, so we are expecting a sharp shot to 1.2400. There we will either see price fixing or bounce.

Expectations: touch at 1.2489 followed by decline to 1.2400 or lower
Solutions: consider selling from 1.2489 to 1.2400
